
Live-streamed games, recorded matches, and event data gathered in one place.
Kill Team Stream hosts quality live streaming of Kill Team content — tournaments throughout the year on Twitch, regular games streamed to the channel, and tournament data gathered so players can see what's happening in the scene. Powered by WARHAMMER.
Browse tournamentsOfferings
Tournaments
Multiple Kill Team tournaments hosted throughout the year, all live-streamed on our Twitch channel.
Videos
Streams are recorded and uploaded to YouTube alongside original video content we produce.
Event Data
Tournament packets from past events plus resources for upcoming Kill Team tournaments.
Site Directory
How to Read Kill Team Win Rate Data Like a Statistician
Win rate looks like one of the clearest statistics in competitive Kill Team. A faction wins 58% of its games, another wins 43%, and the immediate temptation is to label the first one stronger. That interpretation can be useful, but it is rarely complete. A win percentage is an observation produced by a particular group of players, missions, terrain layouts, pairings, and events.
Competitive data becomes much more valuable when you treat it as evidence rather than a verdict. The goal is to identify repeatable patterns while recognizing the uncertainty around every percentage. This approach helps distinguish a genuinely efficient kill team from one that simply appeared in a favorable sample.
Tournament coverage can provide the raw material for that analysis. Results, recorded matches, event packets, and commentary collected through Kill Team Stream offer valuable context that a single leaderboard number cannot provide. Watching how a result happened is often the fastest way to understand what the number is really measuring.
Start With A Precise Definition
Before interpreting a statistic, establish what counts as a win. Does the dataset include only tournament rounds, or does it also contain practice games and league matches? Are draws recorded separately? Were concessions treated as losses? Different answers can produce different win rates for the same roster.
The unit of analysis matters as well. A faction win rate might count every game played by that faction. A player win rate could measure individual performance across several teams. A roster win rate may focus on one specific operative selection. These are related measures, but they should never be treated as interchangeable.
You should also identify the time period and rules environment. Kill Team statistics gathered before a balance update may describe a different strategic landscape from data collected afterward. Changes to missions, equipment, tac ops, terrain guidance, or operative rules can invalidate older comparisons. Always attach a date range and rules version to the number.
Check The Sample Before Trusting The Percentage
A percentage without a sample size is incomplete. If a team has won 12 of 20 games, its observed win rate is 60%. If another has won 600 of 1,000 games, the same percentage carries much stronger evidence because it is based on far more observations.
Small samples are especially common for newly released teams, unusual rosters, and specialist tournament formats. A few strong players can push a faction’s early result upward, while a difficult learning curve can depress its performance before players understand its game plan. Neither effect necessarily reflects the team’s long-term potential.
Look beyond the number of games to the number of players and events. One expert winning repeatedly can make a faction appear dominant when the broader player base is merely average. Likewise, a faction used by many beginners may show a low aggregate win rate even if experienced specialists perform very well with it.
Separate Matchup Strength From Player Skill
Win rates blend the strength of the faction with the skill of the person using it. In statistical terms, player ability is a confounding variable: it influences the result while being mixed into the faction measurement. A roster piloted by a veteran at a major event should not be compared casually with a roster used mostly by first-time tournament players.
Event quality creates another layer of distortion. A team that performs well at a local event may face a wide range of experience levels and list styles. At a major tournament, the same team may face stronger opponents in nearly every round. Comparing raw percentages across these environments can lead to a misleading ranking.
Matchup data can reveal patterns hidden by overall performance. A faction with a 50% aggregate win rate might dominate elite melee teams but struggle badly against shooting-oriented teams. The overall number averages those relationships together. A matchup matrix, separated by opponent faction and event stage, provides a more informative view of strengths and weaknesses.
Compare Metrics Without Losing Their Context
The figures below illustrate why several measurements should be read together. They are hypothetical examples, but they represent the kinds of distinctions that matter in a tournament dataset.
| Measure | Team A | Team B | What It Tells You |
|---|---|---|---|
| Overall win rate | 58% | 52% | Team A won a larger share of recorded games |
| Games recorded | 50 | 400 | Team B’s estimate is based on a much larger sample |
| Win rate against top-half players | 49% | 54% | Team B may be performing better against stronger opposition |
| Average victory margin | 2.1 points | 1.4 points | Team A’s wins may be more decisive |
| Event top-cut appearances | 2 of 8 | 7 of 35 | Team B appears more consistently in larger events |
| Mirror-match win rate | 51% | 51% | The overall gap is not explained by mirror games |
Team A has the higher headline percentage, but Team B offers more stable evidence and stronger results against difficult opponents. If you looked only at the first row, you might conclude that Team A is clearly superior. The full profile suggests a more complicated interpretation: Team A may have a high ceiling, while Team B may be more reliable across a broad competitive field.
Victory margin is useful, but it should not be mistaken for a direct measure of faction power. A team can win many close games through careful objective play, while another can score decisive victories against favorable pairings. Margins are best used as supporting evidence alongside opponent quality, mission data, and event placement.
Measure Uncertainty Around Every Win Rate
An observed win rate is an estimate of an underlying performance level. It is not a permanent property of a faction. With 20 games, a 60% result could plausibly move sharply as more games are added. With 1,000 games, the estimate is generally more stable, although systematic bias can still affect it.
Confidence intervals communicate this uncertainty. For a simple proportion, statistical software can calculate an interval around the observed win rate. A rough 95% interval for 12 wins in 20 games would be wide, while the interval for 600 wins in 1,000 games would be much narrower. The exact method matters, especially with small samples, so Wilson intervals or Bayesian intervals are often preferable to a basic normal approximation.
Bayesian smoothing can make public dashboards easier to interpret. Instead of presenting a new team’s early 80% win rate as if it were established fact, a model can pull that estimate toward a reasonable baseline until more games arrive. This is called shrinkage. It prevents extreme results from a handful of games from dominating the ranking.
Uncertainty does not make data useless. It tells you how strongly to act on the data. A large, consistent difference across many events deserves attention. A five-point gap based on a few dozen games may be an interesting signal, but it should remain provisional.
Account For The Shape Of The Tournament
Tournament structure changes the meaning of results. Swiss rounds reward consistent scoring and may create repeat encounters with opponents near the same record. Single-elimination stages magnify a single bad pairing or mission. A team that reaches a top cut has demonstrated something important, but top-cut frequency is affected by field size, seeding, and the number of rounds.
The missions and terrain package also shape faction performance. A kill team that excels at holding exposed objectives may benefit from a dense mission set, while a team relying on long sightlines may perform differently on an open board. Combining results from events with substantially different terrain or mission rules can conceal these effects.
Strength of schedule is another useful adjustment. A 5–2 record against highly ranked opponents may be more impressive than a 6–1 record produced against a weaker field. Elo-style ratings, opponent win percentage, or performance against the top quartile can help estimate competitive difficulty. None is perfect, but each adds information missing from raw wins and losses.
Time trends deserve separate attention. Plot a team’s win rate by week, event, or rules update rather than relying on one cumulative figure. A falling rate may indicate balance changes, metagame adaptation, or a shift in who is choosing the team. A rising rate may reflect player learning rather than a sudden rules advantage.
Turn The Numbers Into Better Decisions
The purpose of analysis is not to chase the faction with the highest percentage. It is to understand expected performance under conditions similar to your own. A player preparing for a local event should prioritize data from comparable missions, terrain, event sizes, and player pools.
Use a layered reading process. First, check the sample and rules version. Next, examine player and event composition. Then review matchup results, mission performance, and recent trends. Finally, watch representative games to test whether the statistical pattern has a practical explanation.
A data-informed preparation routine can include these actions:
- Record faction, roster, opponent, mission, map, result, event level, and player experience.
- Separate new releases and balance periods instead of combining every historical game.
- Report both the win rate and the number of games behind it.
- Compare performance against opponent tiers, not only against the full field.
- Review losses for recurring tactical causes before changing a roster.
Keep your own records with consistent definitions. A spreadsheet containing 30 carefully classified games may teach you more about your decision-making than a larger public dataset with unclear categories. Track secondary outcomes such as points scored, initiative success, objective control, and operative survival when those measures help explain the final result.
The best statistical habit is to update beliefs gradually. If a team loses several games in a row, do not immediately decide that it is unplayable. If it wins a major event, do not assume every player will reproduce that result. Treat each tournament as another piece of evidence and look for patterns that survive different players, pairings, and environments.
Build A Reliable Competitive Picture
A useful Kill Team dashboard should show more than a single ranked list. Include games played, unique players, events represented, recent win rate, opponent strength, and confidence intervals. Filters for rules version, mission pack, event size, and roster can turn a broad statistic into a relevant one.
Visualizations make trends easier to detect. A rolling win-rate chart can show whether performance is changing, while a matchup heatmap can reveal favorable and unfavorable pairings. A scatter plot comparing popularity with win rate may identify teams that are both common and successful, as well as underplayed teams whose results are difficult to evaluate.
Interpretation should remain transparent. State whether mirror matches are included, how ties are handled, whether concessions count, and whether repeat games from the same event are weighted equally. Clear methodology allows readers to challenge or reproduce the analysis instead of treating the result as an unexplained authority.
When you read tournament statistics, think like an investigator. Ask who played the games, where they were played, which rules applied, and what alternatives were available. Then combine the quantitative record with match footage and expert commentary. Explore current tournament results and recorded games through the competitive match archive to connect statistical patterns with actual decisions on the board.
Win rate data is most powerful when it narrows uncertainty without pretending to eliminate it. Use it to identify questions, test assumptions, and prepare for likely opponents. Apply that method to the next event by recording your results carefully, comparing them with the surrounding field, and turning each match into better evidence for the games that follow.
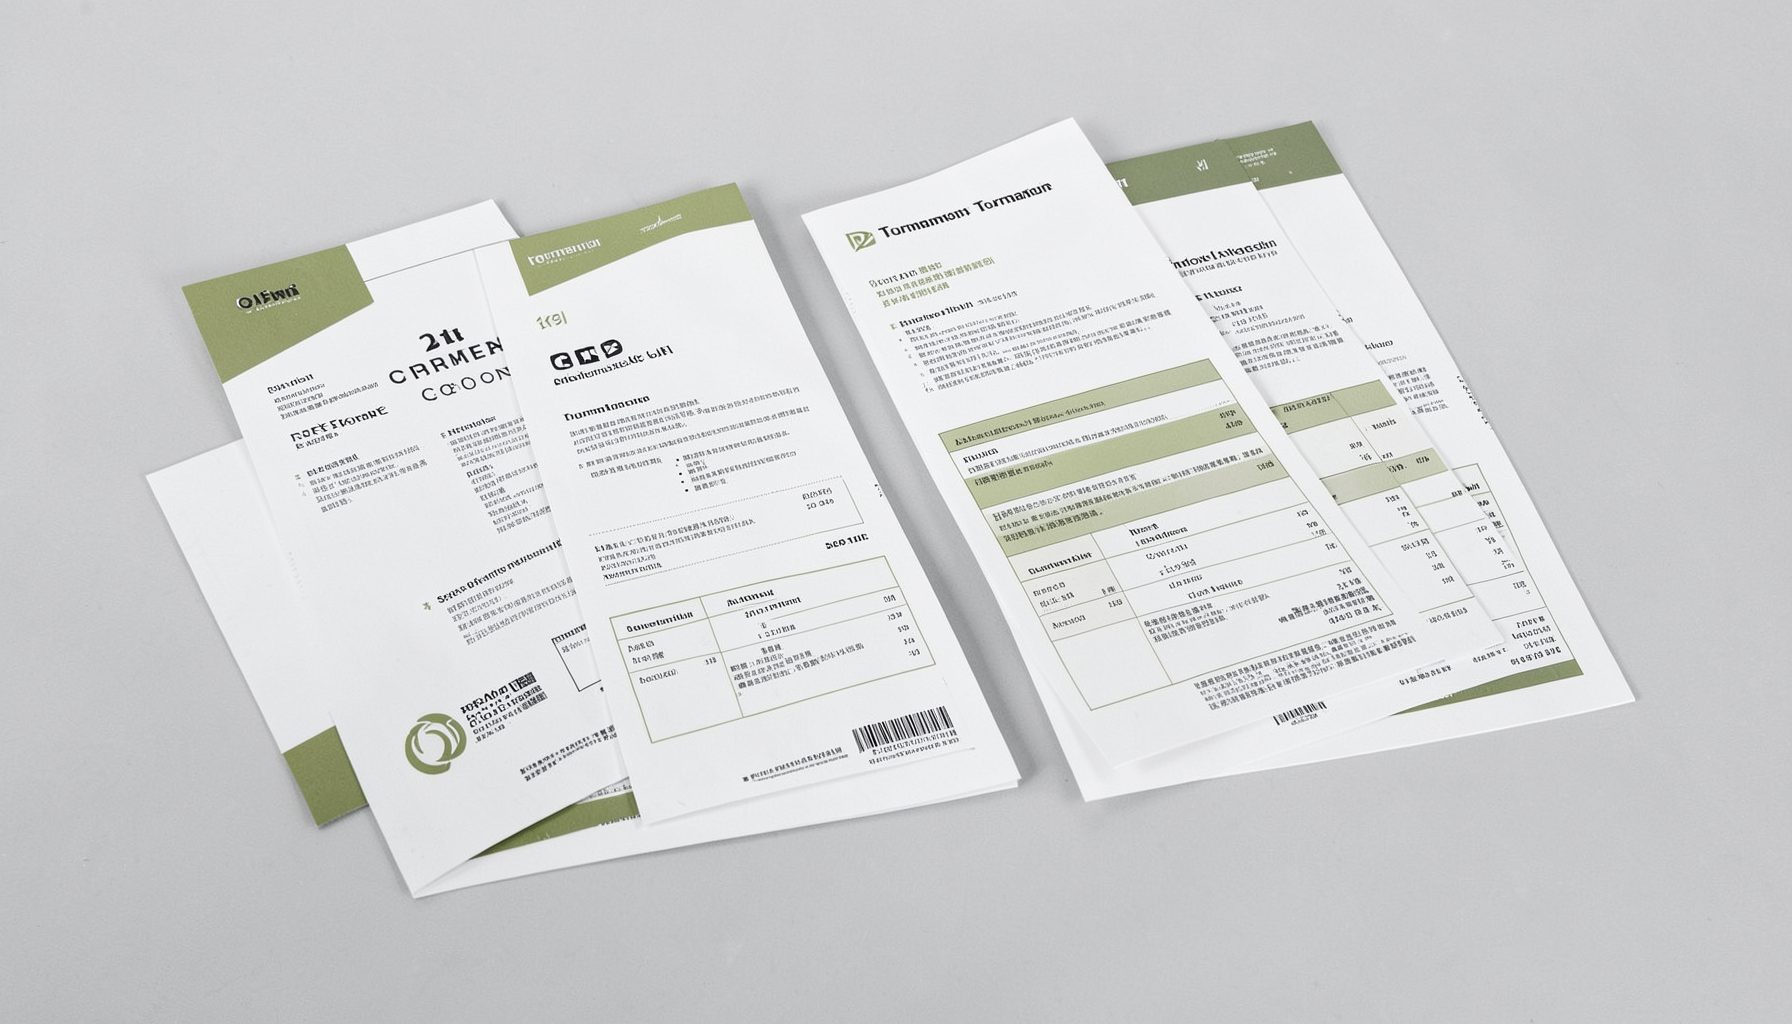
Tournament Packets
Packets from previous Kill Team events are kept here alongside new packets for upcoming tournaments, so organizers and players have what they need in one place.
View Event Data