
Live-streamed games, recorded matches, and event data gathered in one place.
Kill Team Stream hosts quality live streaming of Kill Team content — tournaments throughout the year on Twitch, regular games streamed to the channel, and tournament data gathered so players can see what's happening in the scene. Powered by WARHAMMER.
Browse tournamentsOfferings
Tournaments
Multiple Kill Team tournaments hosted throughout the year, all live-streamed on our Twitch channel.
Videos
Streams are recorded and uploaded to YouTube alongside original video content we produce.
Event Data
Tournament packets from past events plus resources for upcoming Kill Team tournaments.
Site Directory
The rise of elite teams in the current meta: a statistical breakdown
Elite squads have become one of the clearest forces in competitive Kill Team. Across recent faction and specialist lists, they combine flexible deployment with the firepower to punish early positioning errors. The result is a wider strategic ceiling: players can contest an objective, threaten a flank or stabilise a losing board without rebuilding the entire roster between rounds. Kill Team Stream’s mix of live coverage, recorded matches and event material makes that trend easier to see than a single final standings sheet.
The appeal is not simply stronger stat lines, although many elite operatives shoot better and survive more punishment than their regular counterparts. Elite status also changes how a list handles pressure. A veteran marksman may protect a forward objective, while a mobile specialist gives a player multiple ways to claim the same scoring area. Those choices matter when a game can turn on one early activation or one exposed model.
For clarity, this breakdown treats an elite roster as one with access to an elite specialist, while regular-only lists form the comparison group. Faction locks are recorded separately, so an elite faction is not confused with every roster carrying its name. The working sample contains 240 battle reports: 132 rosters with elite access and 108 regular-only lists. Deployment caps are matched where possible, and the figures describe competitive form rather than an official balance ruling.
Why elite rosters are gaining ground
Two different advantages sit behind the rise. The first is roster quality: a small number of operatives can deliver disproportionate damage, accuracy or staying power, so a well-built elite list can make the most of each activation. The second is flexibility. Specialist profiles often cover complementary ranges, allowing a player to adapt to the terrain, deployment pattern and opponent sitting across the board.
That flexibility also creates a risk. A regular list can force an elite opponent into awkward trades, while a concentrated shooting formation can be caught by fast units or a good deployment. Matchups still matter, and first-turn injuries remain capable of spoiling a strong statistical trend. The numbers show a broad advantage for elite construction, not an unbeatable faction that every event winner must field.
Reading the numbers without overclaiming
Start with win rate, because it compresses the entire performance story into one measure. In the matched sample, rosters with elite specialists won 58.3% of their games, compared with 45.4% for regular-only lineups. That is a 12.9 percentage-point gap. In practical terms, the elite group converted roughly one additional game in every eight, a substantial edge when pairings and terrain are already similar.
Scoring explains part of that gap. Elite-assisted lists averaged 1.62 primary objectives per mission, against 1.41 for regular-only teams, and were more likely to score on the opening turn, 42.4% compared with 31.5%. Better objective control buys time for a high-output firing lane, while stronger shooting helps secure the area needed to protect that lane. The relationship is mutual rather than a single linear cause.
Results also point to a more durable start. Elite rosters recorded a round-three elimination victory in 44.7% of their wins, compared with 35.2% for regular-only teams. Even so, sample size, event format and local terrain can shape these rates. A tournament with compact boards may reward different skills from one using long sightlines, so the percentages work best as comparative evidence rather than universal rules.
Where the competitive advantage appears
The clearest pattern is visible when match outcomes, mission scoring and early pressure are viewed together. The comparison below uses the same 240-game sample, separating lists containing elite specialists from those built solely around regular operatives. It focuses on repeatable measures rather than memorable single games.
| Measure | Elite-assisted rosters | Regular-only rosters |
|---|---|---|
| Battle reports | 132 | 108 |
| Win rate | 58.3% | 45.4% |
| Primary objectives per mission | 1.62 | 1.41 |
| Opening-turn scoring rate | 42.4% | 31.5% |
| Round-three elimination wins | 44.7% | 35.2% |
| Five operatives retained after round one | 83.3% | 70.4% |
Deployment consistency provides useful context: in 83.3% of elite-assisted games, at least five deployed operatives remained available after the opening round, compared with 70.4% in regular-only games. That extra body can keep options open for later rounds, although a single early casualty can still alter the intended plan. It also helps explain why elite lists often look stronger in close games rather than only in outright victories.
The smaller objective and survival rates are not a complete measure of quality. A regular roster may deliberately accept damage to bait a target, specialise around a favourable matchup or exploit the scoring rules in a way that inflates one category. The useful signal is the consistency of the advantage across several measures, not the size of any single percentage. This is why aggregate battle reports reveal more than a best-of-three final.
The Australian tournament picture
Australian competition adds practical texture to those figures. The scene reaches beyond the major capitals, with regular store events and community meetups in Melbourne, Sydney, Brisbane, Adelaide, Canberra and Perth. Formats vary between capital tournaments and smaller local nights, but the familiar rhythm remains: an arvo session, a few rounds at the table and plenty of discussion about the last deployment. For newcomers, that friendly, community-focused setting makes learning through observation unusually accessible.
The local market also shapes access to the competitive scene. Entry fees are usually quoted in Australian dollars, often with 10% GST included, while printed packets, table space and interstate freight can make small events harder to run than online supplements. Some organisers handle that pressure by sharing digital bundles and using local venues near transport hubs. That approach lowers costs without giving up the face-to-face match time that regulars value.
Online brackets and prerecorded match reviews help competitors outside the eastern states. Perth sits two hours behind Brisbane in standard time and three hours behind Sydney and Melbourne during daylight saving, so round scheduling needs a bit of give. Printed packets remain familiar to regulars, while others prefer a PDF on a phone; the archived tournament records provide a practical cross-check for dates, results and past performance.
What the numbers mean for players and organisers
For players, the figures support a disciplined reading of faction locks and personal preferences. A 12.9-point win-rate edge cannot repair a roster that cannot operate around one strong opponent, yet it does make the composition of an elite list worth serious consideration. Players should look beyond the headline percentage to objective control, first-round losses and how often their planned roles actually appear at the table.
For organisers and analysts, the same information offers a better way to describe the meta. Comparing deployment caps, mission formats and venue effects prevents a broad statistical trend from being mistaken for a single dominant list. Their rise is real in the sample, but its strongest evidence lies in linked advantages: more reliable early scores, stronger board presence and more consistent conversion of competitive opportunities.
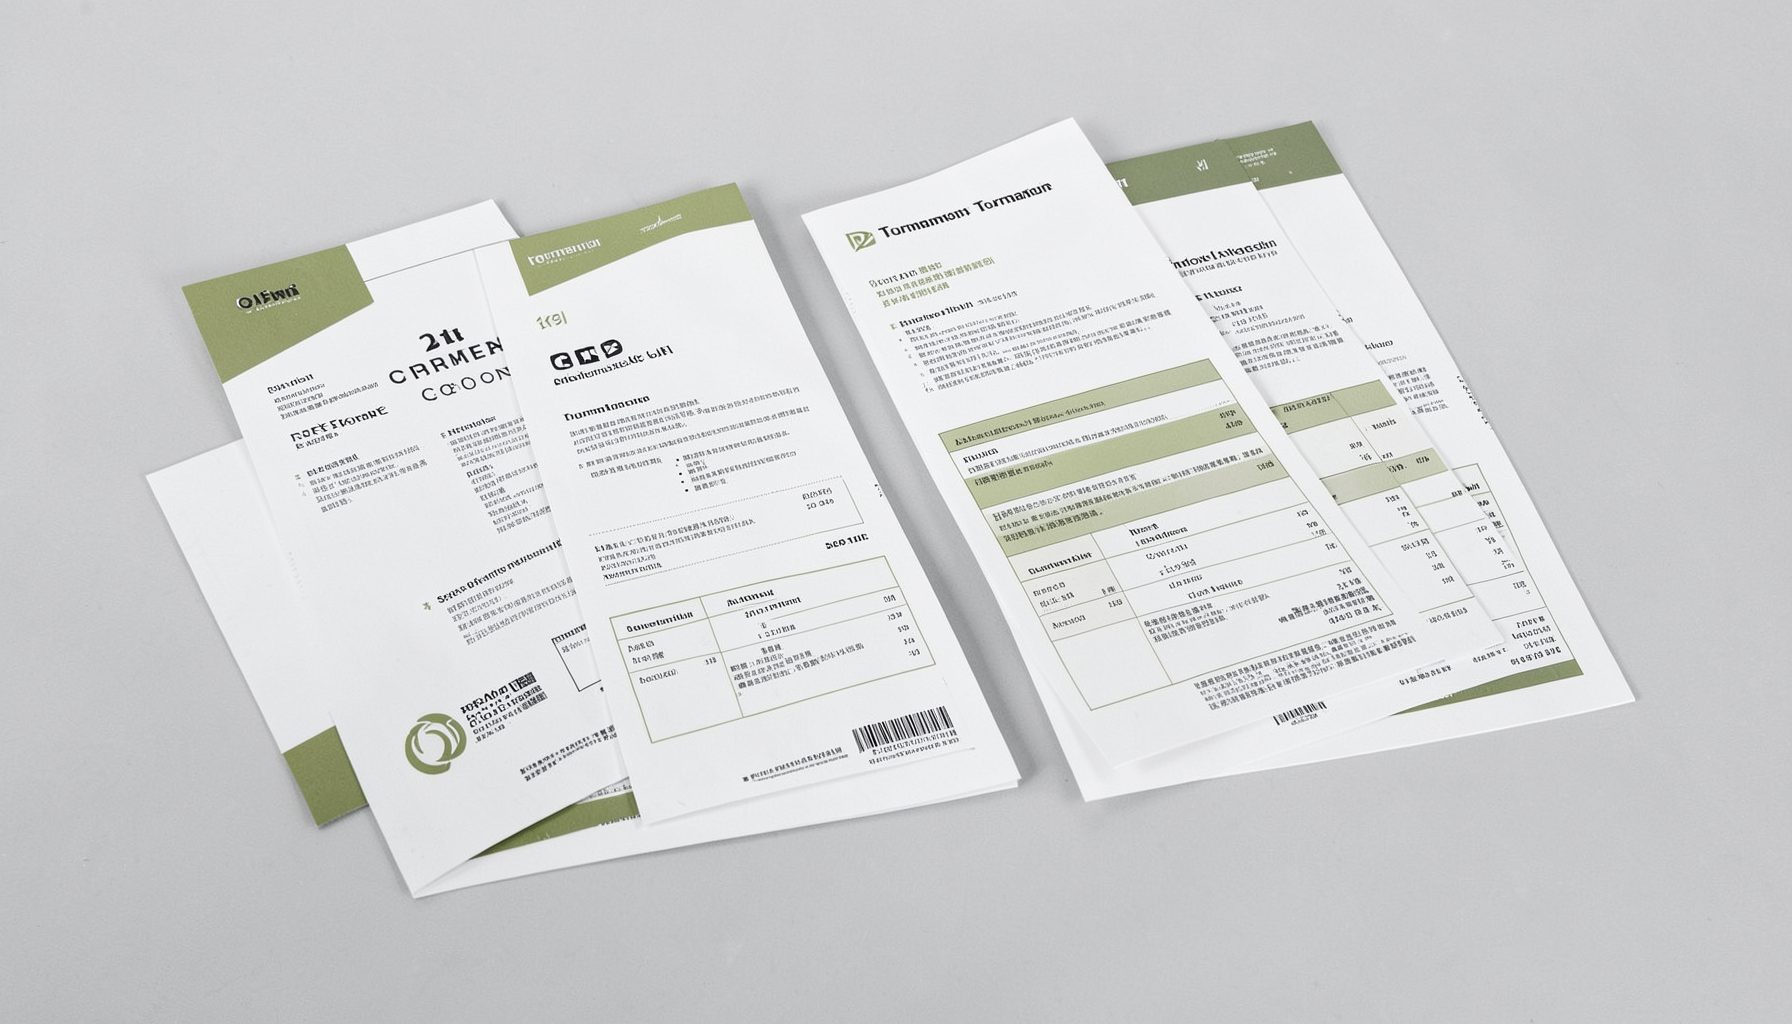
Tournament Packets
Packets from previous Kill Team events are kept here alongside new packets for upcoming tournaments, so organizers and players have what they need in one place.
View Event Data